
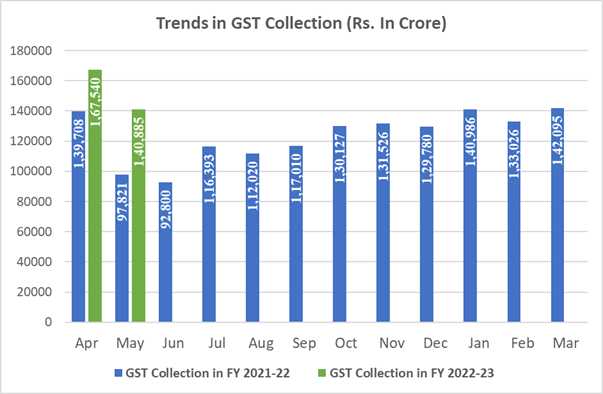
NEW DELHI: India’s GST revenue for May stood at nearly Rs 1.41 lakh crore, a 44 per cent increase over the same month last year, the Finance Ministry said on Wednesday.
Bucking the month-on-month increasing trend of the last two months, the Goods and Services Tax (GST) revenues came in lower than the record high collection in April at Rs 1.68 lakh crore.
In March GST revenues were at Rs 1.42 lakh crore, while in February it was Rs 1.33 lakh crore.
“The gross GST revenue collected in the month of May 2022 is Rs 1,40,885 crore of which CGST is Rs 25,036 crore, SGST is Rs 32,001 crore, IGST is Rs 73,345 crore (including Rs 37469 crore collected on import of goods) and cess is Rs 10,502 crore (including Rs 931 crore collected on import of goods), Ministry said in a statement.
The revenues for the month of May 2022 are 44 per cent higher than the GST revenues in the same month last year at Rs 97,821 crore.
This is the fourth time that the monthly GST collection has crossed Rs 1.40 lakh crore mark since the inception of GST and the third straight month since March 2022.
The collection in May, which pertains to the returns for April — the first month of the financial year — has always been less than that in April, which pertains to the returns for March, the closing of the financial year.
However, it is encouraging to see that even in the month of May 2022, the gross GST revenues have crossed the Rs 1.40 lakh crore mark, the Ministry said.
The total number of e-way bills generated in the month of April 2022 was 7.4 crore, which is 4 per cent lesser than 7.7 crore e-way bills generated in the month of March 2022.
he chart below shows trends in monthly gross GST revenues during the current year. The table shows the state-wise figures of GST collected in each State during the month of May 2022 as compared to May 2021.
State-wise growth of GST Revenues during May 2022[1]
| State | May-21 | May-22 | Growth |
| Jammu and Kashmir | 232 | 372 | 60% |
| Himachal Pradesh | 540 | 741 | 37% |
| Punjab | 1,266 | 1,833 | 45% |
| Chandigarh | 130 | 167 | 29% |
| Uttarakhand | 893 | 1,309 | 46% |
| Haryana | 4,663 | 6,663 | 43% |
| Delhi | 2,771 | 4,113 | 48% |
| Rajasthan | 2,464 | 3,789 | 54% |
| Uttar Pradesh | 4,710 | 6,670 | 42% |
| Bihar | 849 | 1,178 | 39% |
| Sikkim | 250 | 279 | 12% |
| Arunachal Pradesh | 36 | 82 | 124% |
| Nagaland | 29 | 49 | 67% |
| Manipur | 22 | 47 | 120% |
| Mizoram | 15 | 25 | 70% |
| Tripura | 39 | 65 | 67% |
| Meghalaya | 124 | 174 | 40% |
| Assam | 770 | 1,062 | 38% |
| West Bengal | 3,590 | 4,896 | 36% |
| Jharkhand | 2,013 | 2,468 | 23% |
| Odisha | 3,197 | 3,956 | 24% |
| Chattisgarh | 2,026 | 2,627 | 30% |
| Madhya Pradesh | 1,928 | 2,746 | 42% |
| Gujarat | 6,382 | 9,321 | 46% |
| Daman and Diu | 0 | 0 | 153% |
| Dadra and Nagar Haveli | 228 | 300 | 31% |
| Maharashtra | 13,565 | 20,313 | 50% |
| Karnataka | 5,754 | 9,232 | 60% |
| Goa | 229 | 461 | 101% |
| Lakshadweep | 0 | 1 | 148% |
| Kerala | 1,147 | 2,064 | 80% |
| Tamil Nadu | 5,592 | 7,910 | 41% |
| Puducherry | 123 | 181 | 47% |
| Andaman and Nicobar Islands | 48 | 24 | -50% |
| Telangana | 2,984 | 3,982 | 33% |
| Andhra Pradesh | 2,074 | 3,047 | 47% |
| Ladakh | 5 | 12 | 134% |
| Other Territory | 121 | 185 | 52% |
| Center Jurisdiction | 141 | 140 | 0% |
| Grand Total | 70,951 | 1,02,485 | 44% |


